This page is the old 'entry level' page for furnace control. The examples here may be a little easier to understand, but eventually using multiple nodes will make things harder. Prefer to learn the 1-node furnace control technique.
In high temperature electrochemistry a typical goal is to obtain impedance sweeps of the sample at multitude of temperatures. This process may take considerable amount of time and effort as it is typically controlled manually. In general the instruments (furnace and impedance spectrometer) do not communicate with each other.
Controlling furnace temperature profiles automatically can be very beneficial. Most furnace controllers are limited to just to 'go to a new temperature when the user a pushes a button', while others can be programmed multistep profiles. The later can be tedious to achieve and will then perform throughout without any logic.
With Omega software each step of the furnace temperature control can be intelligent and include various conditions.
|
Picture 1 - |
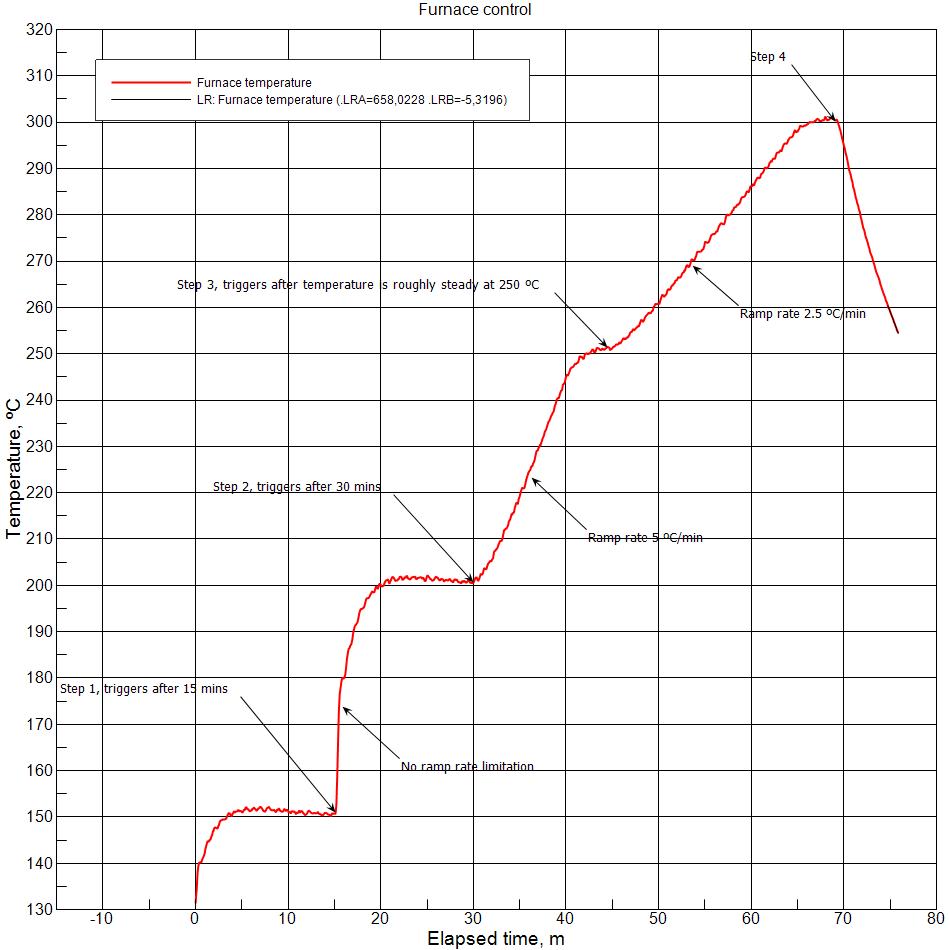
Node $N1 is continuously measuring the furnace temperature and is plotted with a red line.
Initial action to control the furnace was manual. The furnace was sent new setpoint of 150, with ramp rate of 0. The ramp rate 0 allows the furnace to heat as fast as the furnace can.
The step 1 ($N2) action was automatic, pre-programmed to take place 15 minutes after the measurement started. The action sent new setpoint of 200 with ramp rate of 0. The EMIN() function returns elapsed time after the start of the measurement.
The step 2 ($N3) action was automatic, pre-programmed to take place 30 minutes after the measurement started. The action sent new setpoint of 250 with ramp rate of 10 ºC/min.
The step 3 ($N4) action was also automatic, pre-programmed to send new setpoint of 300, with ramp rate 2.5 ºC/min, but only to take place once the current temperature has stabilized at 250 with maximum rate of change being +/- 0.2 ºC/min. The rate of change is received from the liner least squares calculated coefficient tool for plotted series 1. (The Furnace temperature, $S1.LRB)
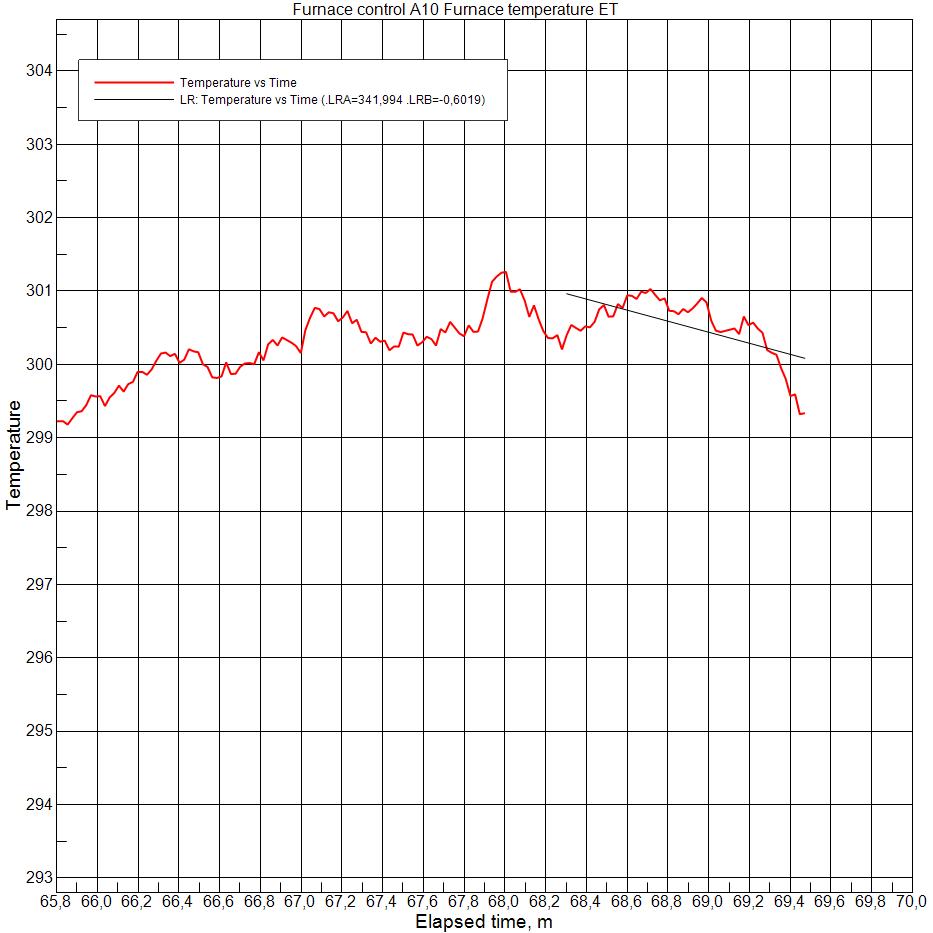
The step 4 ($N5) action was also automatic, pre-programmed to send new setpoint of 20, with ramp rate 0, effectively letting the furnace cool to room temperature on a 'freefall speed'. The trigger conditions for this step were set more strict, 299.5
| Node | Node type | Action | Start condition | Stop condition |
| $N1 | Measure furnace temperature | Plot the data as serie $S1 | 1 | 0 |
| $N2 | Send setpoint | Setpoint 200 Ramprate 0 |
EMIN($N1.TI)>15 | $N2.MAX3>0 |
| $N3 | Send setpoint | Setpoint 250 Ramprate 5 ºC/min |
EMIN($N1.TI)>30 | $N3.MAX3>0 |
| $N4 | Send setpoint | Setpoint 300 Ramprate 10 ºC/min |
($N1.ET>249)&($N1.ET<251)&($S1.LRB<0.2)&($S1.LRB>-0.2) | $N4.MAX3>0 |
| $N5 | Send setpoint | Setpoint 20 Ramprate 0 |
($N1.ET>299.5)&($N1.ET<300.5)&($S1.LRB<0.1)&($S1.LRB>-0.1) | 0 |
The stop conditions with expressions such as $N2.MAX3>0 ensure that the actions will never be repeated once they have been successfully executed once.
The linear least squares coefficient tool for series $S1 was set to include 50 most recent points.

Zoom-in of the temperature plot just when the last step have been initiated and temperature starts to plummet.
This measurement as Omega file. Right click / save as. (With 1/8 of original datapoints.)


